Statlect is a free on-line textbook on probability, statistics and matrix algebra. It contains hundreds of lectures, diagrams, examples and exercises. Explore its main sections.
Fundamentals of probability theory
Read a rigorous yet accessible introduction to the main concepts of probability theory, such as random variables, expected value, variance, correlation, conditional probability.
Explore this compendium of common probability distributions, including the binomial, Poisson, uniform, exponential and normal distributions.
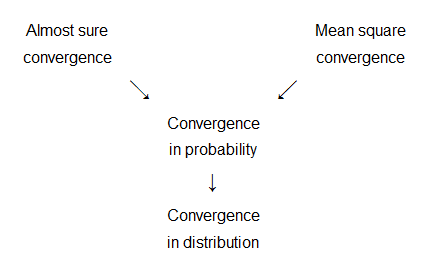
Learn about stochastic convergence, including convergence in probability, almost surely and in distribution; read about the Central Limit Theorem and the Law of Large Numbers.
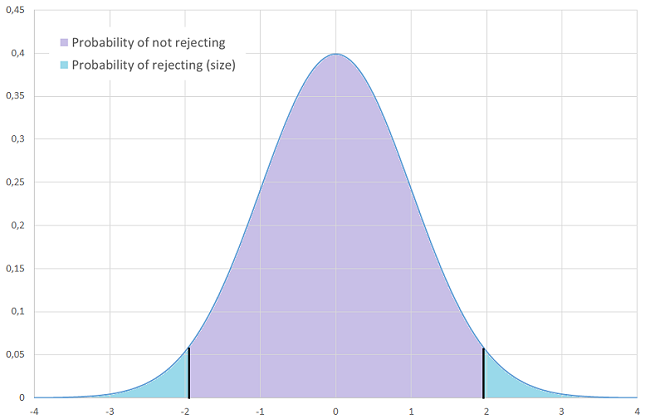
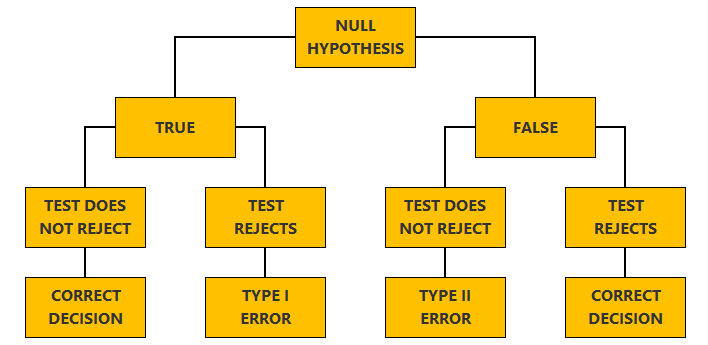
A book-length introduction to the basics of mathematical statistics; learn about statistical inference, point estimation, interval estimation and hypothesis testing.
Lectures on some of the most popular methods and models used in machine learning and predictive analytics, with thoroughly commented Python examples.
Glossary of probability and statistics terms
Use this on-line glossary to review the most important technical terms that are introduced in the digital textbook. Some glossary entries also contain additional explanations and examples.
Learn about mathematical concepts that are frequently used in probability theory and statistics.
This is an online textbook containing about one hundred lectures on the most important topics in matrix algebra.
Review the basics of calculus, learn about the fundamentals of combinatorial analysis, such as permutations and combinations; discover special functions used in statistics.
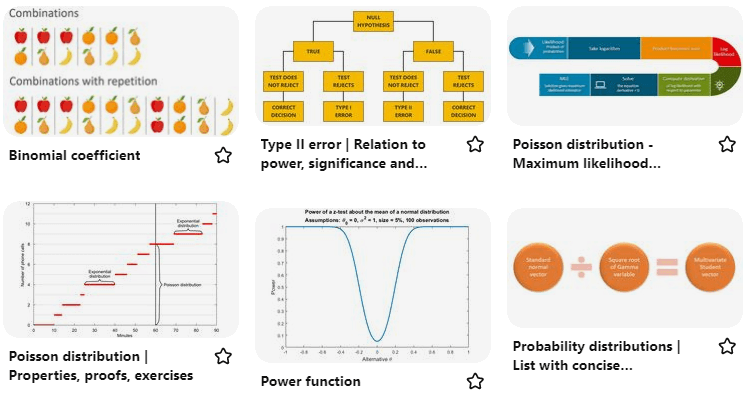
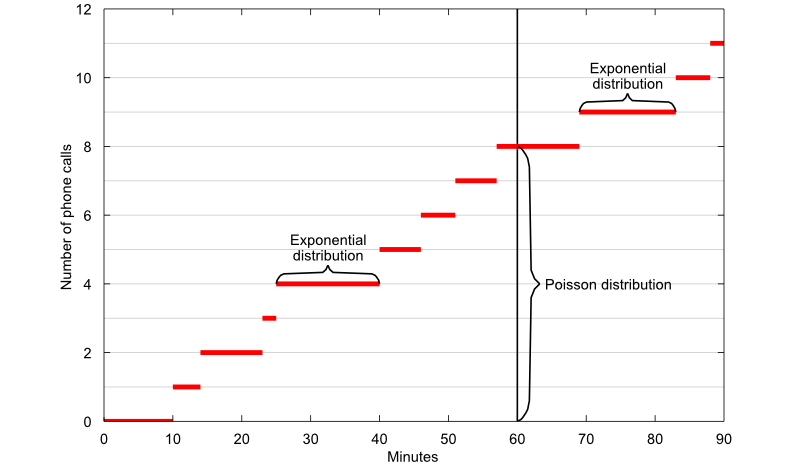
In the online textbook, hundreds of diagrams, images, plots and videos are used to illustrate important concepts in probability and statistics. Here is an example.
Read the latest additions to the digital textbook.
Multiple regression calculator
We created a linear regression tool that you can use in your browser to run regressions effortlessly and without coding.
When some of the assumptions of a statistical model are wrong, then the model is misspecified. The consequences can be catastrophic.
Our Pinterest board collects all the best images in the textbook.
We share the latest additions to StatLect on several social platforms. Subscribe to keep updated.
Here is a selection of popular pages on Statlect, subdivided by topic.
The moment generating function is often used to characterize the probability distribution of a random variable. Its derivatives at zero are equal to the moments of the random variable.
A gentle introduction to the concept of expected value, with an informal definition and more formal definitions based on the Stieltjes and Lebesgue integrals.
Bayes' rule is a formula that allows us to compute the conditional probability of a given event, after observing a second event whose conditional and unconditional probabilities were known in advance.
The Beta function is often employed in probability theory and statistics, for example, as a normalizing constant in the density functions of the F and Student's t distributions.
The exponential distribution is a continuous probability distribution used to model the time we need to wait before a given event occurs.
The Beta distribution is a continuous probability distribution having two parameters. One of its most common uses is to model one's uncertainty about the probability of success of an experiment.
The Poisson distribution is a discrete probability distribution used to model the number of occurrences of an unpredictable event within a unit of time.
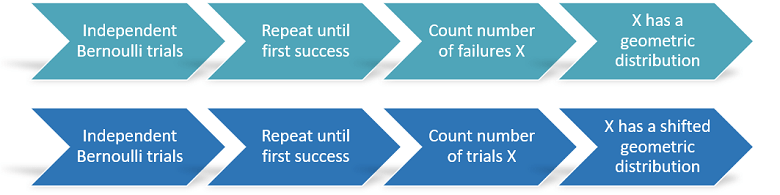
A discrete distribution used to model the number of successes obtained by repeating several times an experiment that can have two outcomes, either success or failure.
The concept of convergence in probability is based on the following intuition: two random variables are "close to each other" if there is a high probability that their difference will be very small.
A Central Limit Theorem provides a set of conditions that are sufficient for the sample mean to have a normal distribution asymptotically (as the sample size increases).
Maximum likelihood is an estimation method that allows us to use observed data to estimate the parameters of the probability distribution that generated the data.
A statistical test based on the comparison of two parameter estimates, a restricted one and an unrestricted one.
The digital textbook contains several lectures on the linear regression model. This is the introductory one.
A test that is often performed on parameters that have been estimated by maximum likelihood, based on a test statistic called the Wald statistic.
The ridge estimator of the coefficients of a linear regression is biased but can have lower mean squared error than the OLS estimator.
Model selection criteria, such as the Akaike Information Criterion (AIC) are used to select the best model among a set of candidate statistical models.
The logit model is a classification model used to predict the realization of a binary variable on the basis of a set of regressors.
If an explanatory variable in a linear regression is highly correlated with a linear combination of other variables, then coefficient estimates are very imprecise.
Most of the learning materials found on this website are now available in a traditional textbook format.