In a statistical test, observed data is used to decide whether or not to reject a restriction on the data-generating probability distribution.
The assumption that the restriction is true is called null hypothesis, while the statement that the restriction is not true is called alternative hypothesis.
A correct specification of the alternative hypothesis is essential to decide between one-tailed and two-tailed tests.
![]()
Table of contents
Usually, the null hypothesis is denoted by
![]() ,
while the alternative hypothesis is denoted by
,
while the alternative hypothesis is denoted by
![]() .
.
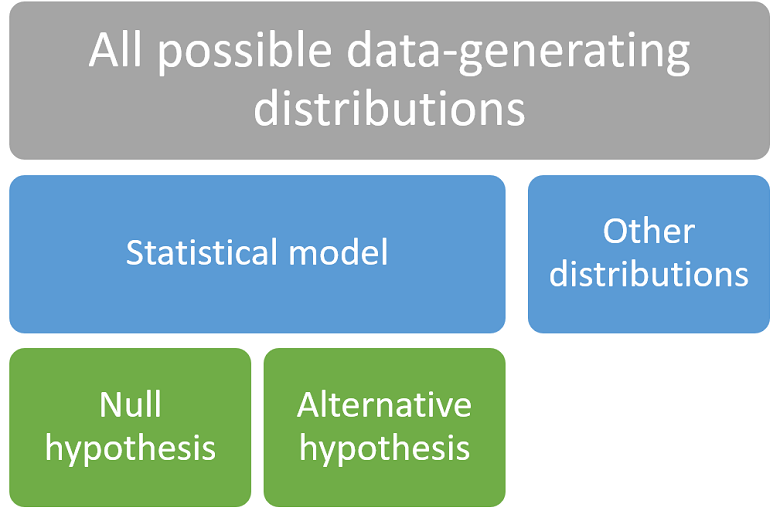
In order to fully understand the concept of alternative hypothesis, we need to remember the essential elements of a statistical inference problem:
we observe a sample drawn from an unknown probability distribution;
in principle, any valid probability distribution could have generated the sample;
however, we usually place some a priori restrictions on the set of possible data-generating distributions;
the restricted set of distributions, denoted by
![]() ,
is called a statistical model.
,
is called a statistical model.
A couple of simple examples follow.
Example
If we assume that the data are drawn from a
normal
distribution, then the statistical model
![]() is the set of all normal distributions.
is the set of all normal distributions.
Example
Suppose that the data are extracted from a distribution with unit
variance. Then
![]() is the set of all probability
distributions that have unit variance.
is the set of all probability
distributions that have unit variance.
When we conduct a statistical test, we formulate a null hypothesis as a restriction on the statistical model.
Denote by
![]() the true data-generating distribution.
the true data-generating distribution.
The null hypothesis can be expressed
as![]() where
where
![]() is a subset of
is a subset of
![]() .
.
The alternative hypothesis is
![]() where
where![]() is
the complement of
is
the complement of
![]() ,
that is, the subset of
,
that is, the subset of
![]() that comprises all the distributions not belonging to
that comprises all the distributions not belonging to
![]() .
.
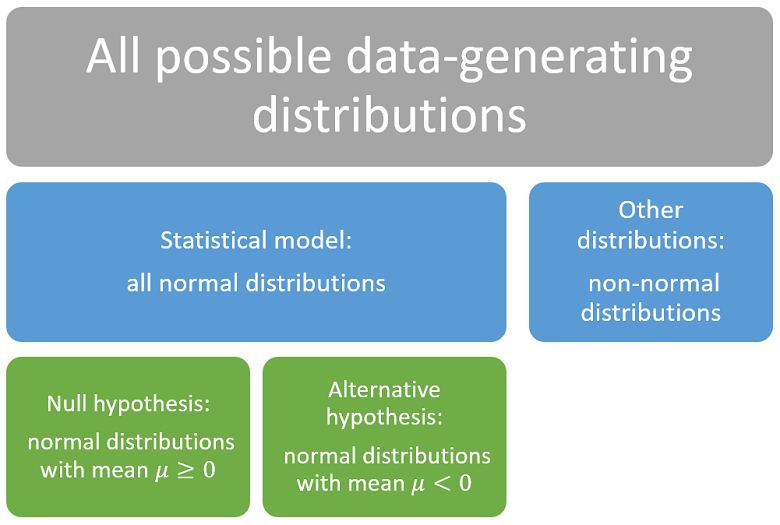
Let the statistical model
![]() be the set of all normal distributions.
be the set of all normal distributions.
The null hypothesis is that the mean
![]() of the data-generating distribution is positive.
of the data-generating distribution is positive.
Then
![]() is the set of all normal distributions with positive mean.
is the set of all normal distributions with positive mean.
For simplicity, we write the null hypothesis
as![]()
It follows that
![]() is the set of all normal distributions with strictly negative mean.
is the set of all normal distributions with strictly negative mean.
We write the alternative hypothesis
as![]()
The alternative hypothesis is used to decide whether a test should be one-tailed or two-tailed.
The null hypothesis is rejected if the test statistic falls within a critical region that has been chosen by the statistician.
The critical region is a set of values that may comprise:
only the left tail of the distribution or only the right tail (one-tailed test);
both the left and the right tail (two-tailed test).
The choice of the critical region depends on the alternative hypothesis. Let us see why.
Usually, when the test statistic falls within the critical region, the
rejection of the null hypothesis is clearly interpreted as evidence that the
data-generating distribution
![]() comes from a set of distributions
comes from a set of distributions
![]() that is disjoint from
that is disjoint from
![]() (remember that
(remember that
![]() ).
The subscript
).
The subscript
![]() stands for interpretation.
stands for interpretation.
The interpretation is different depending on the tail of the distribution in which the test statistic falls.
Example
Consider a test
of hypothesis for the mean of a normal distribution, where we test
![]() .
The test statistic is the
z-statistic
.
The test statistic is the
z-statistic![[eq7]](/images/alternative-hypothesis__27.png) where
where
![]() is the sample mean,
is the sample mean,
![]() is the variance of the distribution and
is the variance of the distribution and
![]() is the sample size. If we run a two-tailed test with
critical value
is the sample size. If we run a two-tailed test with
critical value
![]() ,
the critical region
,
the critical region
![]() is the union of the right and left tails of the distribution of
is the union of the right and left tails of the distribution of
![]() :
:![]() The
test statistic falls in the right tail (i.e.,
The
test statistic falls in the right tail (i.e.,
![]() )
when the sample mean
)
when the sample mean
![]() is much larger than zero. In this case, the rejection of the null hypothesis
is interpreted as evidence that, most likely,
is much larger than zero. In this case, the rejection of the null hypothesis
is interpreted as evidence that, most likely,
![]() ;
the set of distributions
;
the set of distributions
![]() is the set of all normal distributions with strictly positive mean.
is the set of all normal distributions with strictly positive mean.
The choice between a one-tailed or a two-tailed test needs to be done in such a way that the interpretation of a rejection is always coherent with the alternative hypothesis.
In other words, we must ensure
that![]()
Example
As in the previous example, consider a test about the mean of a normal
distribution, where we test
![]() .
Suppose that we exclude a priori that
.
Suppose that we exclude a priori that
![]() can be negative. In other words, the statistical model
can be negative. In other words, the statistical model
![]() includes all the normal distributions with mean
includes all the normal distributions with mean
![]() .
It follows that
.
It follows that
![]() includes all the normal distributions with
includes all the normal distributions with
![]() and the alternative hypothesis is
and the alternative hypothesis is
![]() .
Can we use a two-tailed z-test? No because if the sample mean is much lower
than zero and the test statistic falls within the left tail, then the
interpretation is that, most likely,
.
Can we use a two-tailed z-test? No because if the sample mean is much lower
than zero and the test statistic falls within the left tail, then the
interpretation is that, most likely,
![]() .
But this was excluded a priori in the formulation of the statistical model.
Thus, the interpretation would be incoherent with the alternative hypothesis:
.
But this was excluded a priori in the formulation of the statistical model.
Thus, the interpretation would be incoherent with the alternative hypothesis:
![]() would not be included in
would not be included in
![]() .
As a consequence, we need to perform a one-tailed test, in which the critical
region includes only the right tail.
.
As a consequence, we need to perform a one-tailed test, in which the critical
region includes only the right tail.
When we deal with the power function of a test, the term "alternative hypothesis" has a special meaning.
Suppose that we are conducting a test about a parameter
![]() ,
in which the null hypothesis is
,
in which the null hypothesis is
![]()
The power function
![]() is a function that gives, for any
is a function that gives, for any
![]() ,
the probability of rejecting
,
the probability of rejecting
![]() when the true parameter is equal to
when the true parameter is equal to
![]() .
.
The argument
![]() is often called alternative hypothesis and
is often called alternative hypothesis and
![]() is called power against the alternative
is called power against the alternative
![]() .
.
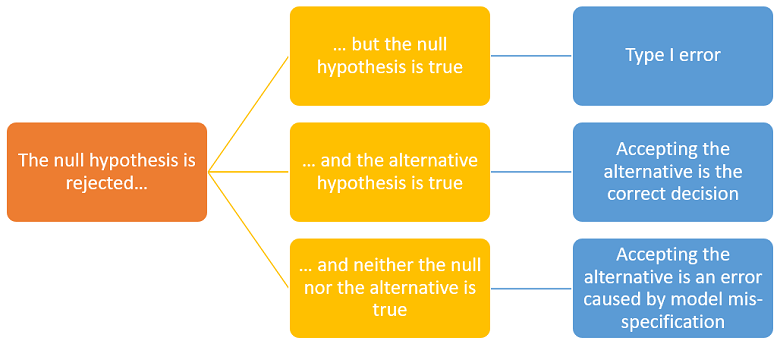
We conclude with a caveat about the interpretation of the outcome of a test of hypothesis.
The interpretation of a rejection of the null is controversial.
According to some statisticians, rejecting the null is equivalent to accepting the alternative.
However, others deem that rejecting the null does not necessarily imply accepting the alternative. In fact, it is possible to think of situations in which both hypotheses can be rejected. Let us see why.
According to the conceptual framework illustrated by the images above, there are three possibilities:
the null is true;
the alternative is true;
neither the null nor the alternative is true because the true data-generating distribution has been excluded from the statistical model (we say that the model is mis-specified).
If we are in case 3, accepting the alternative after a rejection of the null is an incorrect decision. Moreover, a second test in which the alternative becomes the new null may lead us to another rejection.
You can find more details about the alternative hypothesis in the lecture on Hypothesis testing.
Previous entry: Almost sure
Next entry: Binomial coefficient
Please cite as:
Taboga, Marco (2021). "Alternative hypothesis", Lectures on probability theory and mathematical statistics. Kindle Direct Publishing. Online appendix. https://www.statlect.com/glossary/alternative-hypothesis.
Most of the learning materials found on this website are now available in a traditional textbook format.