The exponential distribution is a continuous probability distribution used to model the time elapsed before a given event occurs.
Sometimes it is also called negative exponential distribution.

![]()
Table of contents
The exponential distribution is frequently used to provide probabilistic answers to questions such as:
How much time will elapse before an earthquake occurs in a given region?
How long do we need to wait until a customer enters our shop?
How long will it take before a call center receives the next phone call?
How long will a piece of machinery work without breaking down?
All these questions concern the time we need to wait before a given event occurs.
If this waiting time is unknown, it is often appropriate to think of it as a random variable having an exponential distribution.
A waiting time
![]() has an exponential distribution if the probability that the event occurs
during a certain time interval is proportional to the length of that time
interval.
has an exponential distribution if the probability that the event occurs
during a certain time interval is proportional to the length of that time
interval.
More precisely,
![]() has an exponential distribution if the conditional
probability
has an exponential distribution if the conditional
probability![]() is
approximately proportional to the length
is
approximately proportional to the length
![]() of the time interval comprised between the times
of the time interval comprised between the times
![]() and
and
![]() ,
for any time instant
,
for any time instant
![]() .
.
In several practical situations this property is realistic. This is the reason why the exponential distribution can be used to model waiting times.
The exponential distribution is characterized as follows.
Definition
Let
![]() be a continuous
random variable. Let its
support be the set
of positive real
numbers:
be a continuous
random variable. Let its
support be the set
of positive real
numbers:![]() Let
Let
![]() .
We say that
.
We say that
![]() has an exponential distribution with parameter
has an exponential distribution with parameter
![]() if and only if its
probability density
function
is
if and only if its
probability density
function
is![[eq4]](data:image/gif;base64,R0lGODlhAQABAIAAANvf7wAAACH5BAEAAAAALAAAAAABAAEAAAICRAEAOw==) The
parameter
The
parameter
![]() is called rate parameter.
is called rate parameter.
A random variable having an exponential distribution is also called an exponential random variable.
The following is a proof that
![]() is a legitimate probability density function.
is a legitimate probability density function.
Non-negativity is obvious. We need to prove
that the integral of
![]() over
over
![]() equals
equals
![]() .
This is proved as
follows:
.
This is proved as
follows:
To better understand the exponential distribution, you can have a look at its density plots.
We have mentioned that the probability that the event occurs between two dates
![]() and
and
![]() is proportional to
is proportional to
![]() (conditional on the information that it has not occurred before
(conditional on the information that it has not occurred before
![]() ).
).
The rate parameter
![]() is the constant of
proportionality:
is the constant of
proportionality:![]() where
where
![]() is an infinitesimal of higher order than
is an infinitesimal of higher order than
![]() (i.e. a function of
(i.e. a function of
![]() that goes to zero more quickly than
that goes to zero more quickly than
![]() does).
does).
The above proportionality condition is also sufficient to completely characterize the exponential distribution.
Proposition
The proportionality
condition![]() is
satisfied only if
is
satisfied only if
![]() has an exponential distribution.
has an exponential distribution.
The conditional probability
![]() can be written
as
can be written
as![[eq12]](/images/exponential-distribution__33.png) Denote
by
Denote
by
![]() the distribution function
of
the distribution function
of
![]() ,
that
is,
,
that
is,![]() and
by
and
by
![]() its survival
function:
its survival
function:![]() Then,Dividing
both sides by
Then,Dividing
both sides by
![]() ,
we
obtainwhere
,
we
obtainwhere
![]() is a quantity that tends to
is a quantity that tends to
![]() when
when
![]() tends to
tends to
![]() .
Taking limits on both sides, we
obtainor,
by the definition of
derivative:This
differential equation is easily solved by using the chain
rule:Taking
the integral from
.
Taking limits on both sides, we
obtainor,
by the definition of
derivative:This
differential equation is easily solved by using the chain
rule:Taking
the integral from
![]() to
to
![]() of both sides, we
getand
of both sides, we
getand![]() or
or![]() But
But
![]() (because
(because
![]() cannot take negative values)
implies
cannot take negative values)
implies![]() Exponentiating
both sides, we
obtain
Exponentiating
both sides, we
obtain![]() Therefore,
Therefore,![]() or
or![]() But
the density function is the first derivative of the distribution
function:and
the rightmost term is the density of an exponential random variable.
Therefore, the proportionality condition is satisfied only if
But
the density function is the first derivative of the distribution
function:and
the rightmost term is the density of an exponential random variable.
Therefore, the proportionality condition is satisfied only if
![]() is an exponential random variable
is an exponential random variable
The expected value of an exponential random
variable
![]() is
is![]()
It
can be derived as
follows:![[eq32]](/images/exponential-distribution__64.png)
The variance of an exponential random variable
![]() is
is![]()
It
can be derived thanks to the usual
variance formula
(![]() ):
):![[eq35]](/images/exponential-distribution__68.png)
The moment generating function of an
exponential random variable
![]() is defined for any
is defined for any
![]() :
:![]()
The
definition of moment generating function
givesOf
course, the above integrals converge only if
![]() ,
i.e. only if
,
i.e. only if
![]() .
Therefore, the moment generating function of an exponential random variable
exists for all
.
Therefore, the moment generating function of an exponential random variable
exists for all
![]() .
.
The characteristic function of an exponential
random variable
![]() is
is![]()
By
using the definition of characteristic function and the fact that
![]() we
can
writeWe
now compute separately the two integrals. The first integral
is
we
can
writeWe
now compute separately the two integrals. The first integral
is![[eq42]](/images/exponential-distribution__80.png) Therefore,which
can be rearranged to
yieldorThe
second integral
is
Therefore,which
can be rearranged to
yieldorThe
second integral
is![[eq46]](/images/exponential-distribution__84.png) Therefore,which
can be rearranged to
yieldorBy
putting pieces together, we
get
Therefore,which
can be rearranged to
yieldorBy
putting pieces together, we
get
The distribution function of an exponential random variable
![]() is
is
If
![]() ,
then
,
then![]() because
because
![]() can not take on negative values. If
can not take on negative values. If
![]() ,
then
,
then
In the following subsections you can find more details about the exponential distribution.
One of the most important properties of the exponential distribution is the
memoryless property:
![]() for
any
for
any
![]() .
.
This is proved as
follows:
![]() is the time we need to wait before a certain event occurs. The above property
says that the probability that the event happens during a time interval of
length
is the time we need to wait before a certain event occurs. The above property
says that the probability that the event happens during a time interval of
length
![]() is independent of how much time has already elapsed
(
is independent of how much time has already elapsed
(![]() )
without the event happening.
)
without the event happening.
Suppose that
![]() ,
,
![]() ,
...,
,
...,
![]() are
are
![]() mutually independent random variables having
exponential distribution with parameter
mutually independent random variables having
exponential distribution with parameter
![]() .
.
Define
Then, the sum
![]() is a Gamma random variable with parameters
is a Gamma random variable with parameters
![]() and
and
![]() .
.
This is proved using moment generating
functions (remember that the moment generating function of a sum of mutually
independent random variables is just the product of their moment generating
functions):The
latter is the moment generating function of a Gamma distribution with
parameters
![]() and
and
![]() .
So
.
So
![]() has a Gamma distribution, because two random variables have the same
distribution when they have the same moment generating function.
has a Gamma distribution, because two random variables have the same
distribution when they have the same moment generating function.
The random variable
![]() is also sometimes said to have an Erlang distribution.
is also sometimes said to have an Erlang distribution.
The Erlang distribution is just a special case of the Gamma distribution: a Gamma random variable is an Erlang random variable only when it can be written as a sum of exponential random variables.
The exponential distribution is strictly related to the Poisson distribution.
Suppose that
an event can occur more than once;
the time elapsed between two successive occurrences is exponentially distributed and independent of previous occurrences.
Then, the number of occurrences of the event within a given unit of time has a Poisson distribution.
We invite the reader to see the lecture on the Poisson distribution for a more detailed explanation and an intuitive graphical representation of this fact.
The exponential distribution is the continuous counterpart of the geometric distribution, which is instead discrete.
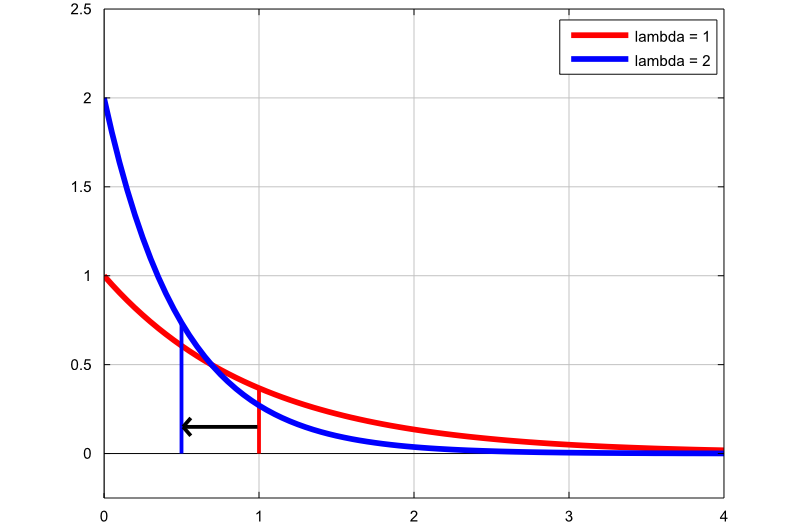
The next plot shows how the density of the exponential distribution changes by changing the rate parameter:
the first graph (red line) is the probability density function of an
exponential random variable with rate parameter
![]() ;
;
the second graph (blue line) is the probability density function of an
exponential random variable with rate parameter
![]() .
.
The thin vertical lines indicate the means of the two distributions. Note
that, by increasing the rate parameter, we decrease the mean of the
distribution from
![]() to
to
![]() .
.
Below you can find some exercises with explained solutions.
Let
![]() be an exponential random variable with parameter
be an exponential random variable with parameter
![]() .
Compute the following
probability:
.
Compute the following
probability:![]()
First of all we can write the probability
asusing
the fact that the probability that a continuous random variable takes on any
specific value is equal to zero (see Continuous
random variables and zero-probability events). Now, the probability can be
written in terms of the distribution function of
![]() as
as![[eq61]](/images/exponential-distribution__125.png)
Suppose the random variable
![]() has an exponential distribution with parameter
has an exponential distribution with parameter
![]() .
Compute the following
probability:
.
Compute the following
probability:![]()
This probability can be easily computed
by using the distribution function of
![]() :
:
What is the probability that a random variable
![]() is less than its expected value, if
is less than its expected value, if
![]() has an exponential distribution with parameter
has an exponential distribution with parameter
![]() ?
?
The expected value of an exponential
random variable with parameter
![]() is
is![]() The
probability above can be computed by using the distribution function of
The
probability above can be computed by using the distribution function of
![]() :
:
Please cite as:
Taboga, Marco (2021). "Exponential distribution", Lectures on probability theory and mathematical statistics. Kindle Direct Publishing. Online appendix. https://www.statlect.com/probability-distributions/exponential-distribution.
Most of the learning materials found on this website are now available in a traditional textbook format.